 Joy G. Bertling is an assistant professor and team leader of art education at the University of Tennessee. She currently serves as founding chair of the National Art Education Association’s Ecology and Environment Special Interest Group and chair of the American Educational Research Association’s Arts and Learning Special Interest Group. She is the author of Art Education for a Sustainable Planet: Embracing Ecopedagogy in K–12 Classrooms.
In recent years, contemporary artists have transformed standard data visualization practices. Departing from graphical approaches, such as bar graphs, pie charts, and scatter plots, artists have foregrounded emotion, affect, perceptual experience, and metaphor to produce memorable, divergent data visualizations. These data visualizations include sculptural objects, two-dimensional works with pictorial elements, art installations, kinetic art, performances, and sound art. For instance, artists and designers have created:
- Quilts mapping home foreclosures in major U.S. cities (Clark, 2011)
- Popsicles containing water samples from various Taiwanese waterways with popsicle wrappers labeling the pollutants in each popsicle (Yi-Chen et al., 2017)
- Glowing laser lights on factory emission clouds fluctuating alongside a community’s real-time energy conservation (HeHe, 2008)
- Hand-crank machines that release coins at the rate a minimum-wage worker is paid (Fall-Conroy, 2016).
These types of visualizations humanize data and make numbers meaningful and captivating. As these works commonly employ visual metaphor and sometimes irony, they have the capability to bring unexpected associations and new layers of meaning to the issues inherent to the data.
Within this broad category of data visualization, eco-visualizations represent a subset of data visualizations that communicate trends and patterns in ecological, environmental, and sustainability data (Holmes, 2007). Typically, eco-visualizations are meant to educate the public about a particular ecological process or issue, and, often, advocate directly or indirectly for ecologically sustainable practices. As such, eco-visualizations can serve an important ecopedagogical function.
With climate-related issues intensifying, eco-artists have increasingly attempted to help others realize the lasting impact of unchecked human activities on the planet. For example, an array of eco-visualizations have focused specifically on the ramifications of climate change for coastal areas. With sea levels projected to rise further, these works make these levels visible and point toward the impacts for more-than-human communities. In this blog, I will introduce some of these visualizations and then explore the ecopedagogical possibilities associated with integrating such works and practices into curricula.
Using light and lenses, Studio Roosegaarde simulated a flood in Waterlicht (2016-2022). This site-specific installation at Loevestein Castle in the Netherlands allowed viewers a chance to immerse themselves in and contemplate the real possibility of future flooding at the historic site (Studio Roosegaarde, 2023).
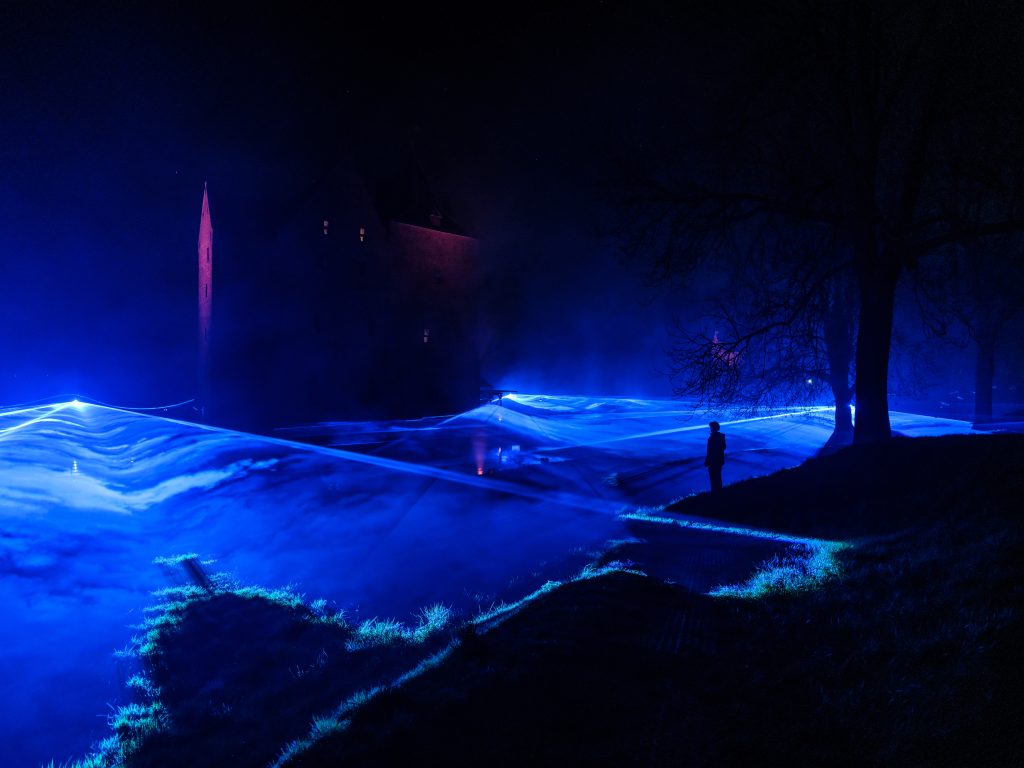
Figure 1. Daan Roosegaarde, Waterlicht, 2016-2022. www.studioroosegaarde.net
Other artists have attended more to the specific height of future sea levels by focusing on measurement and attending to specific projections. Adam Kuby’s Sea Level Clock #1 provides a gauge with which to measure rising tides and Timo Aho and Pekka Niittyvirta’s installation Lines (57° 59’ N, 7° 16’W) clearly demarcates projected sea levels across a small Scottish coastal town.
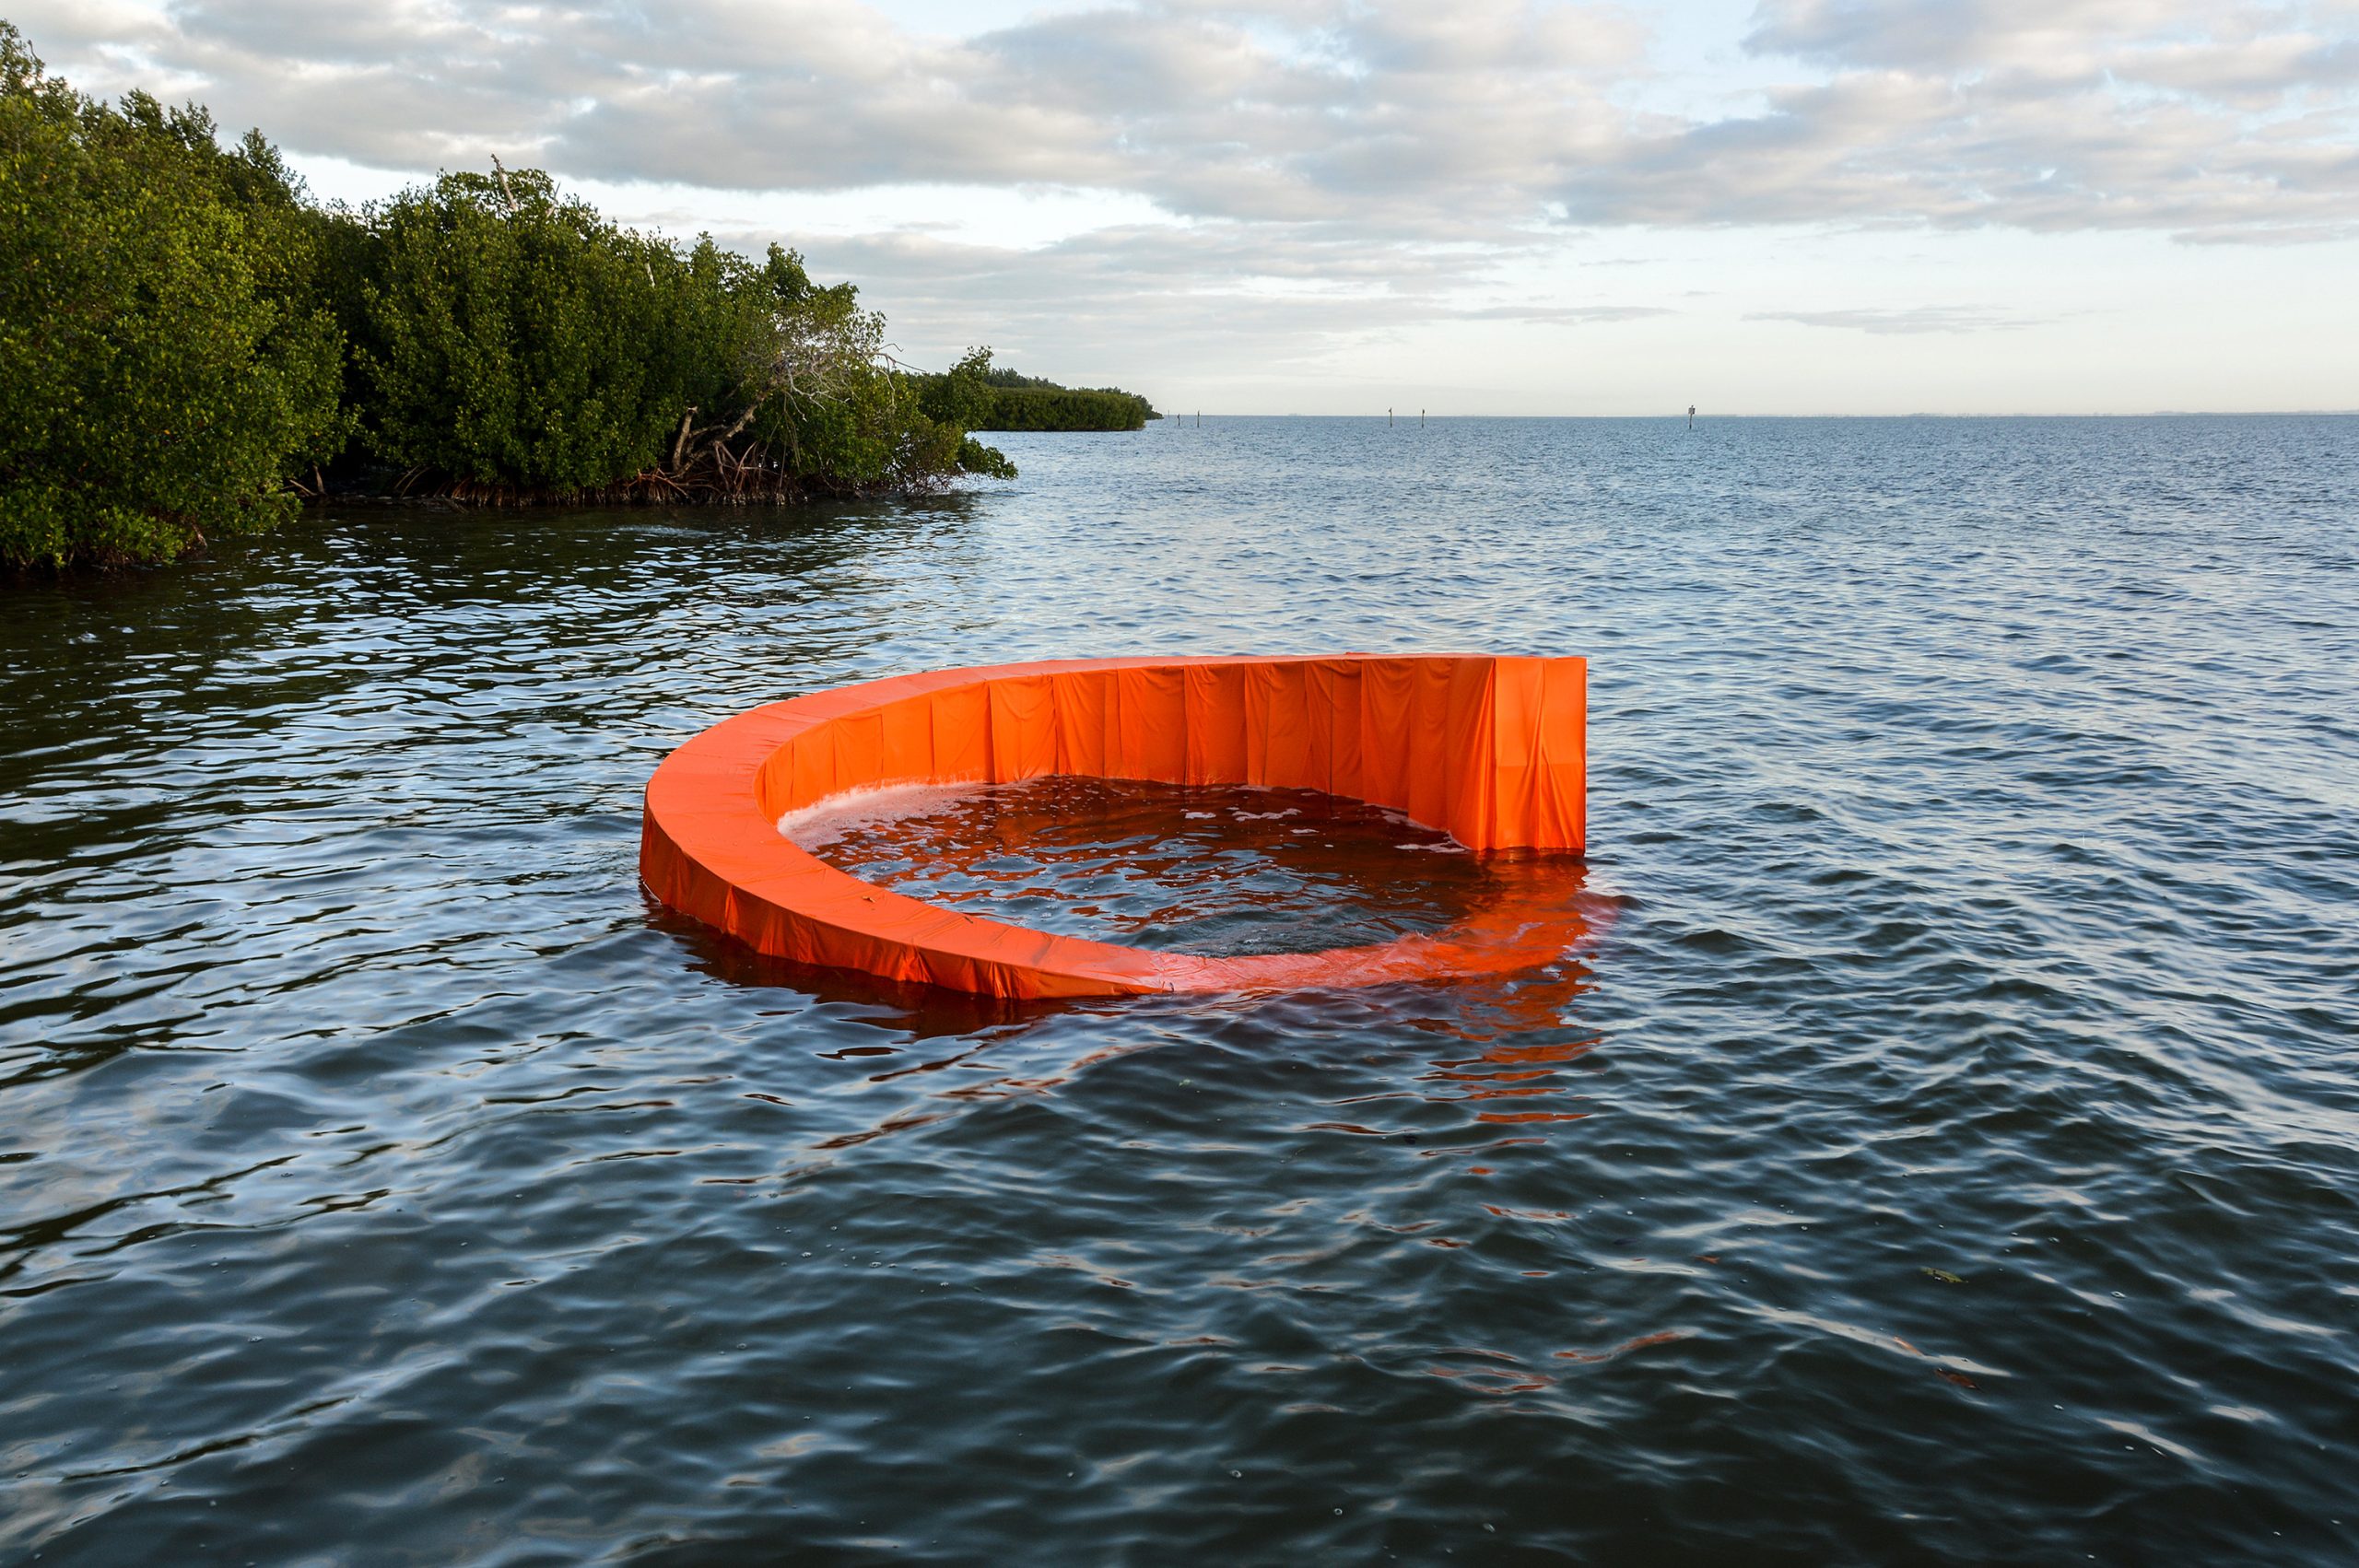
Figure 2. Adam Kuby, Sea Level Clock #1, 2017
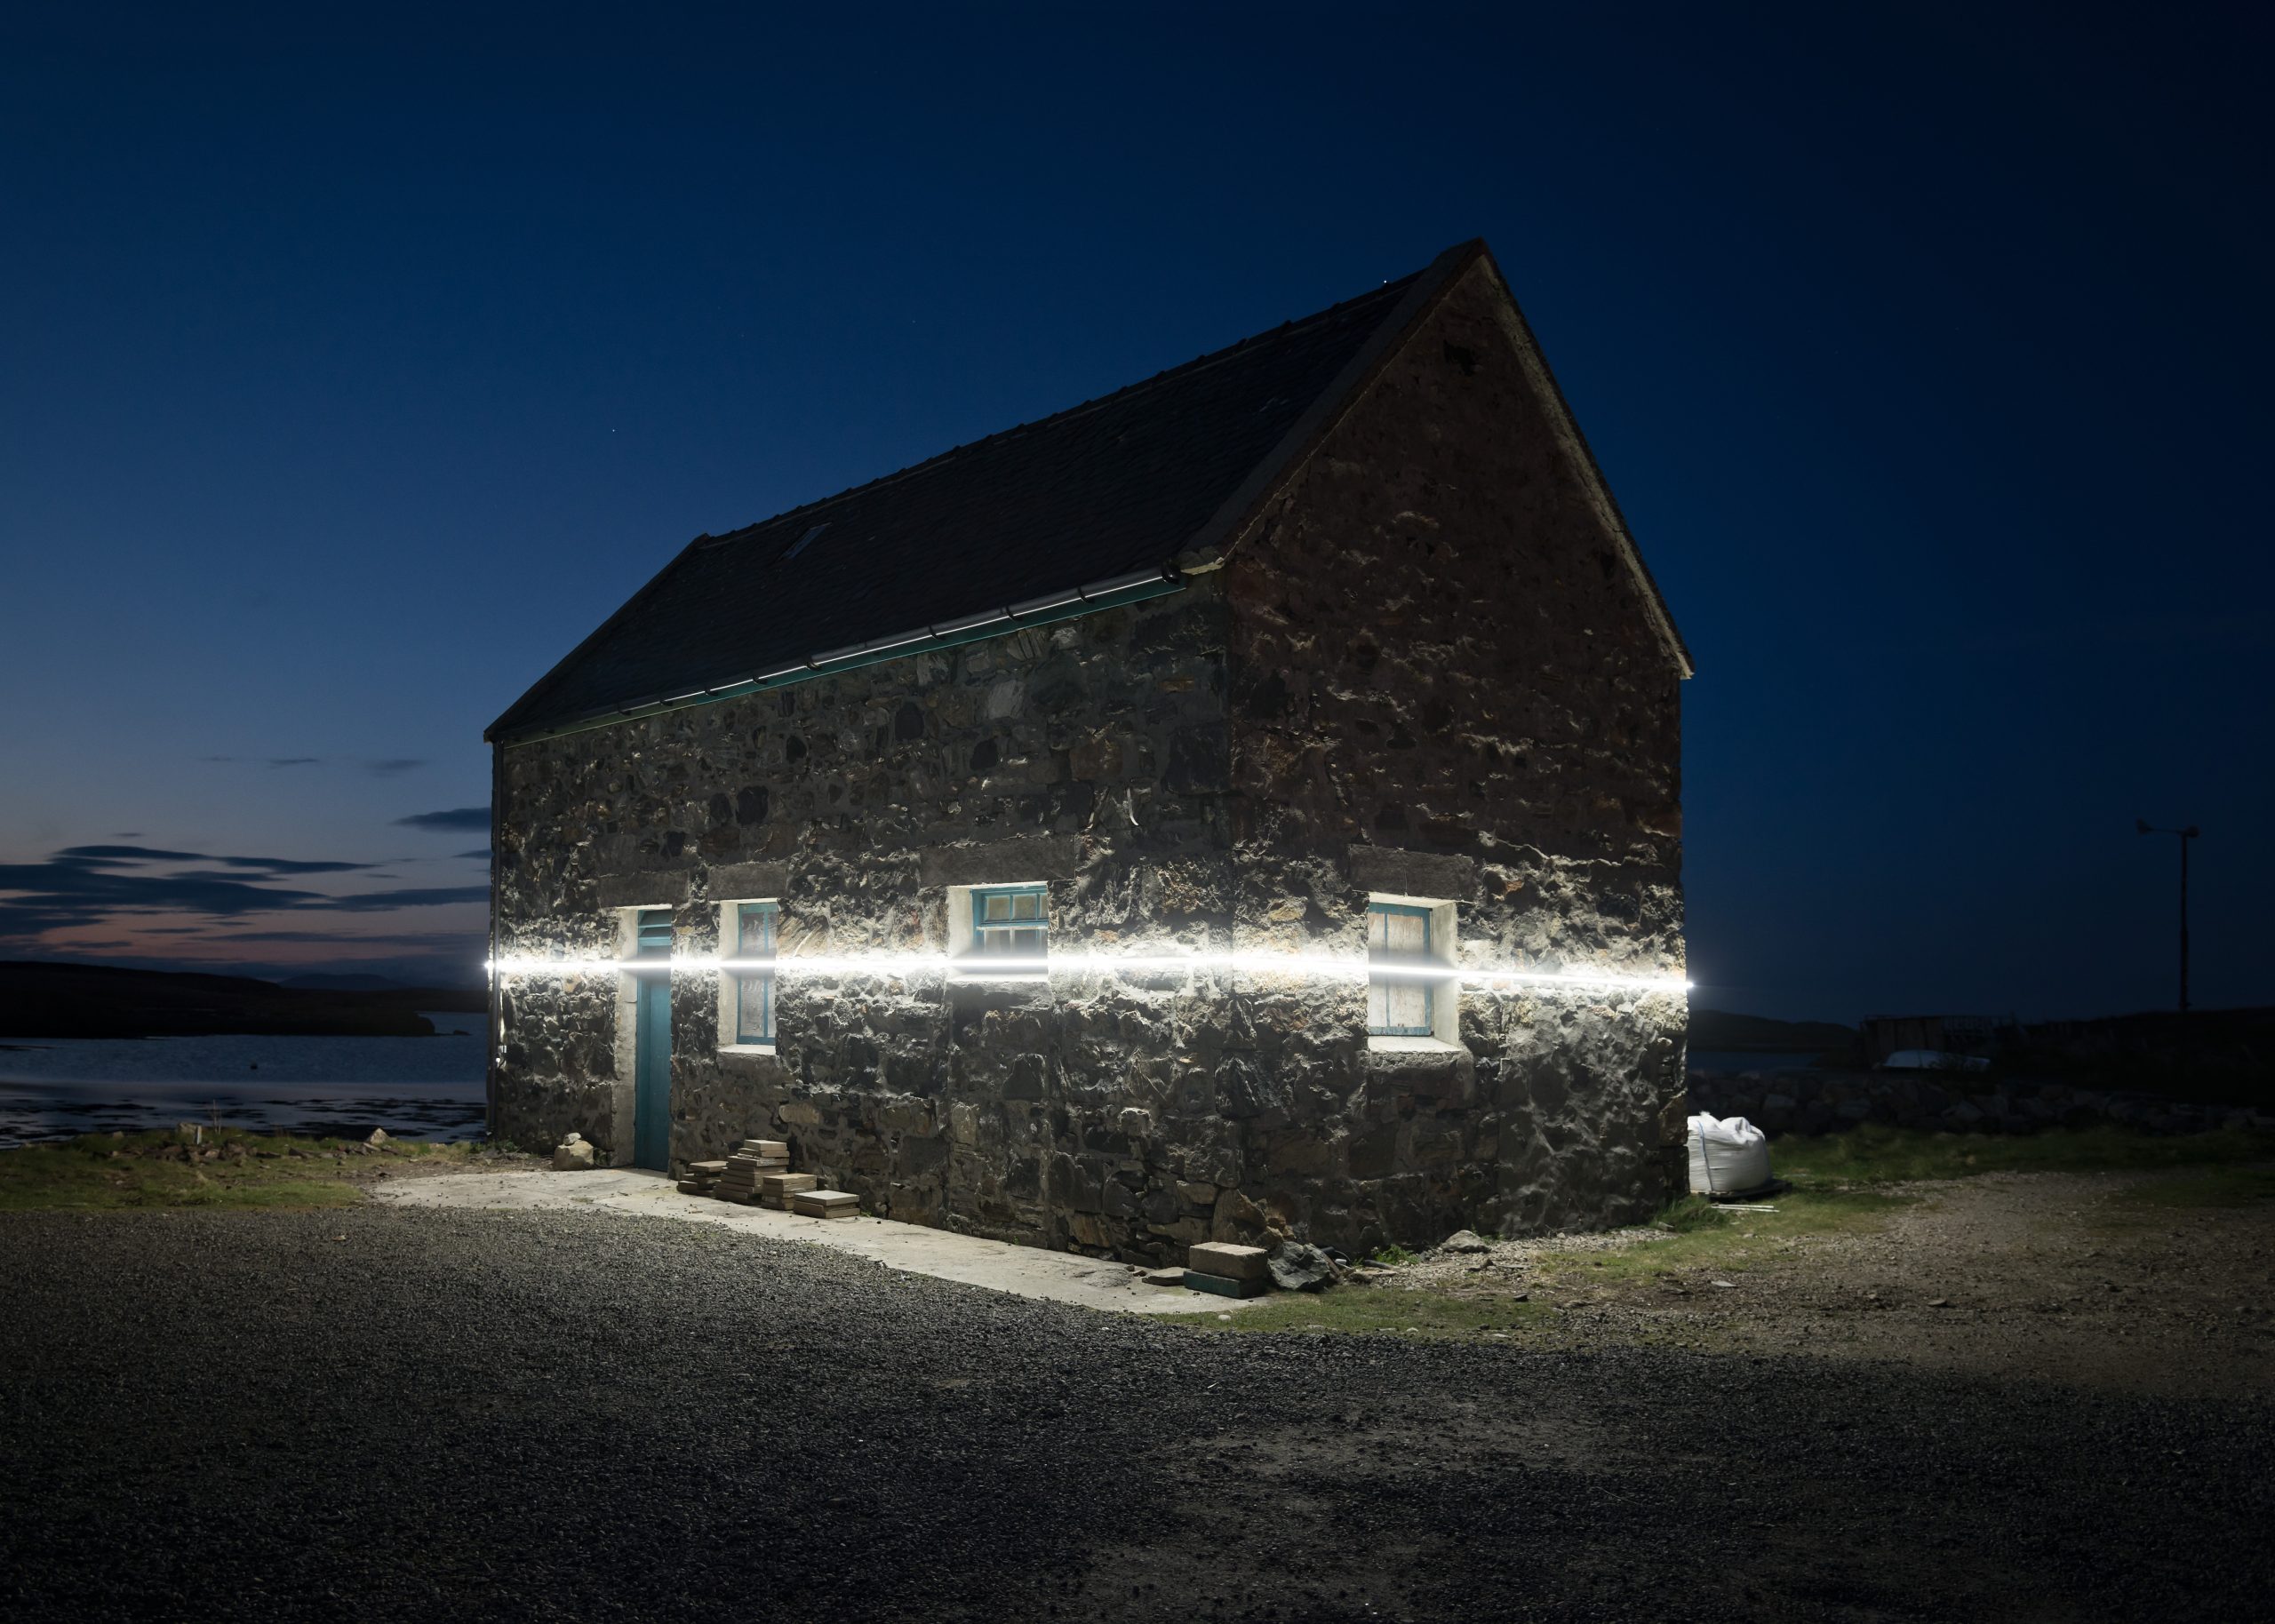
Figure 3. Pekka Niittyvirta and Timo Aho, Lines (57° 59’ N, 7° 16’W), 2018. Photographer: Pekka Niittyvirta
In FutureSHORELINE, Carolina Aragón (2020) examined specific sea level projections over time. The colors and heights of her floating barges correspond to water heights that would result if the 1% annual chance of climate-related flooding were to occur. In the blue barge in the background of the figure below, the top three platforms correspond to the flooding levels that could ensue in 2030, 2050, and 2070, in ascending order.
Figure 4. Carolina Aragón, FutureSHORELINE, 2020. Photographer: Matt Conti
Delving further into the implications of rising sea level heights for human communities, Timo Aho and Pekke Niittyvirta in collaboration with Google Arts and Culture (2020) designed Coastline Paradox, an interactive online platform, where users could select global locations and years, from 2000 to 2300, to see how various coastal areas will be affected. While every location will be impacted, this platform shows how certain regions and cities are especially vulnerable.
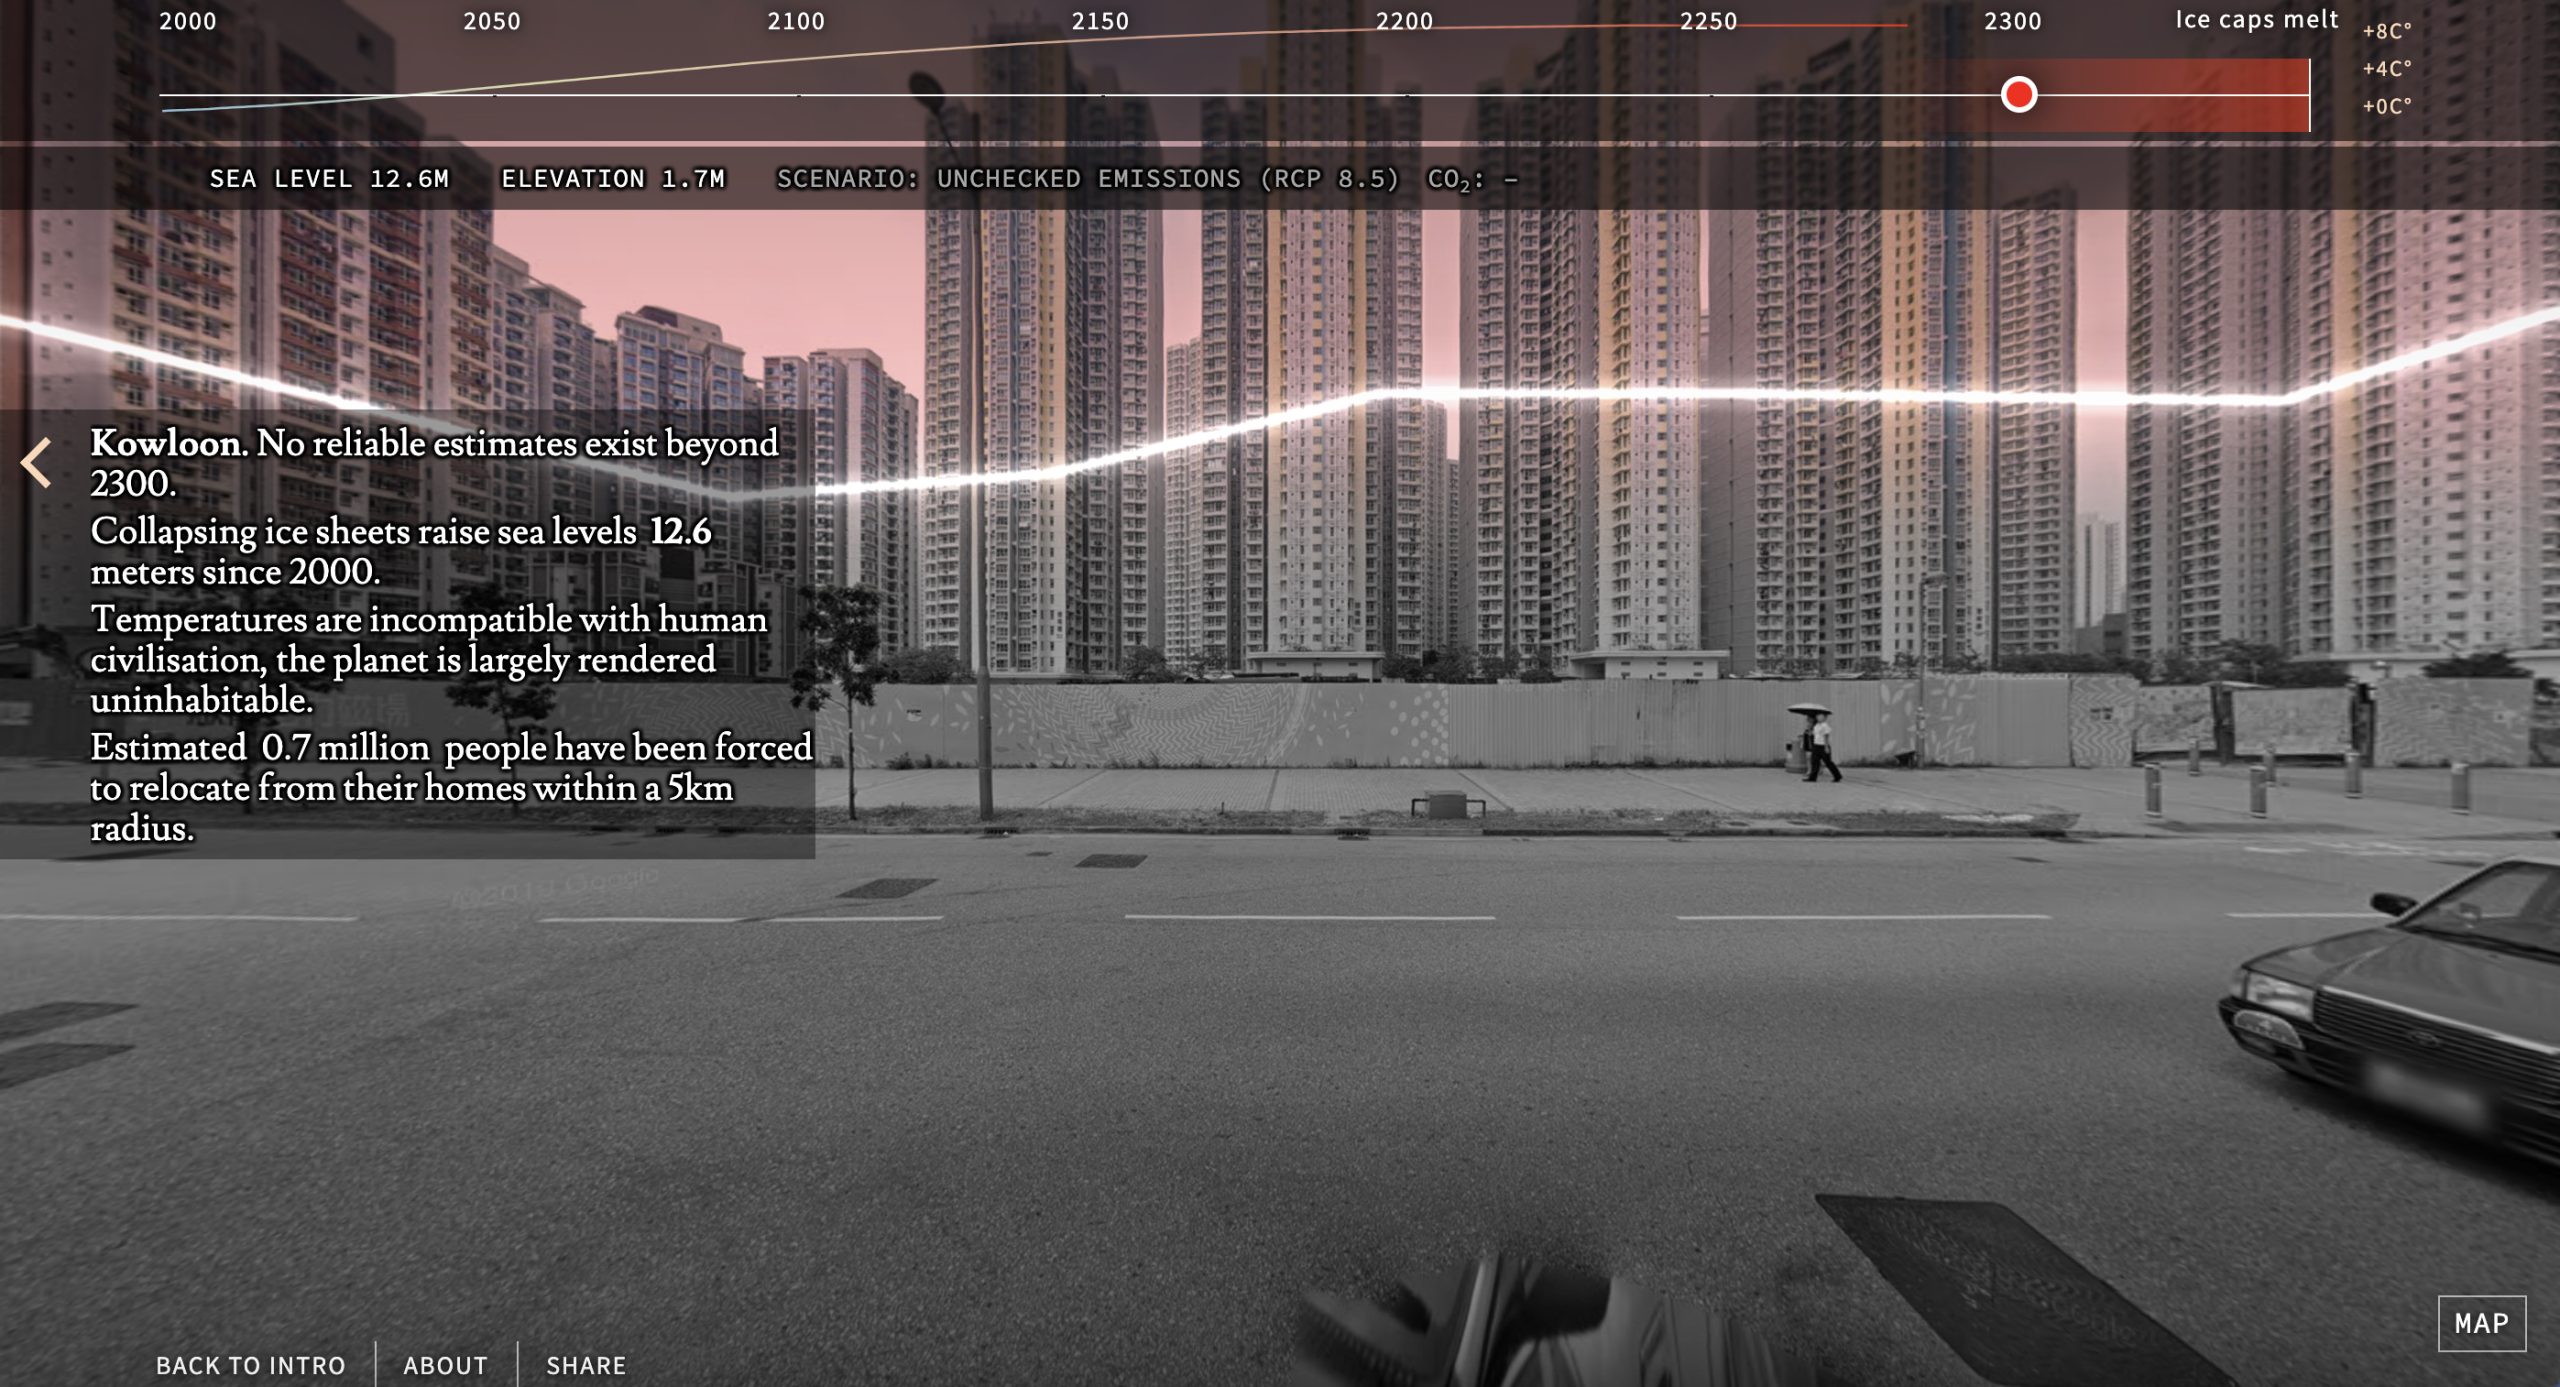
Figure 5. Timo Aho and Pekka Niittyvirta in collaboration with Google Arts and Culture, Coastline Paradox, 2020
Looking toward actions that might mitigate climate-change impacts, Jill Pelto (2021), in Rising Mitigation, visualized sea-level projections in relation to renewable energy usage. In the background, a stacked bar chart represents Maine’s increasing reliance upon renewable energy. Cutting across the illustration, a blue line signifies growing sea level heights with the three dotted lines representing three different sea-level projections for the next 80 years, based upon the extent to which renewable energy is adopted.
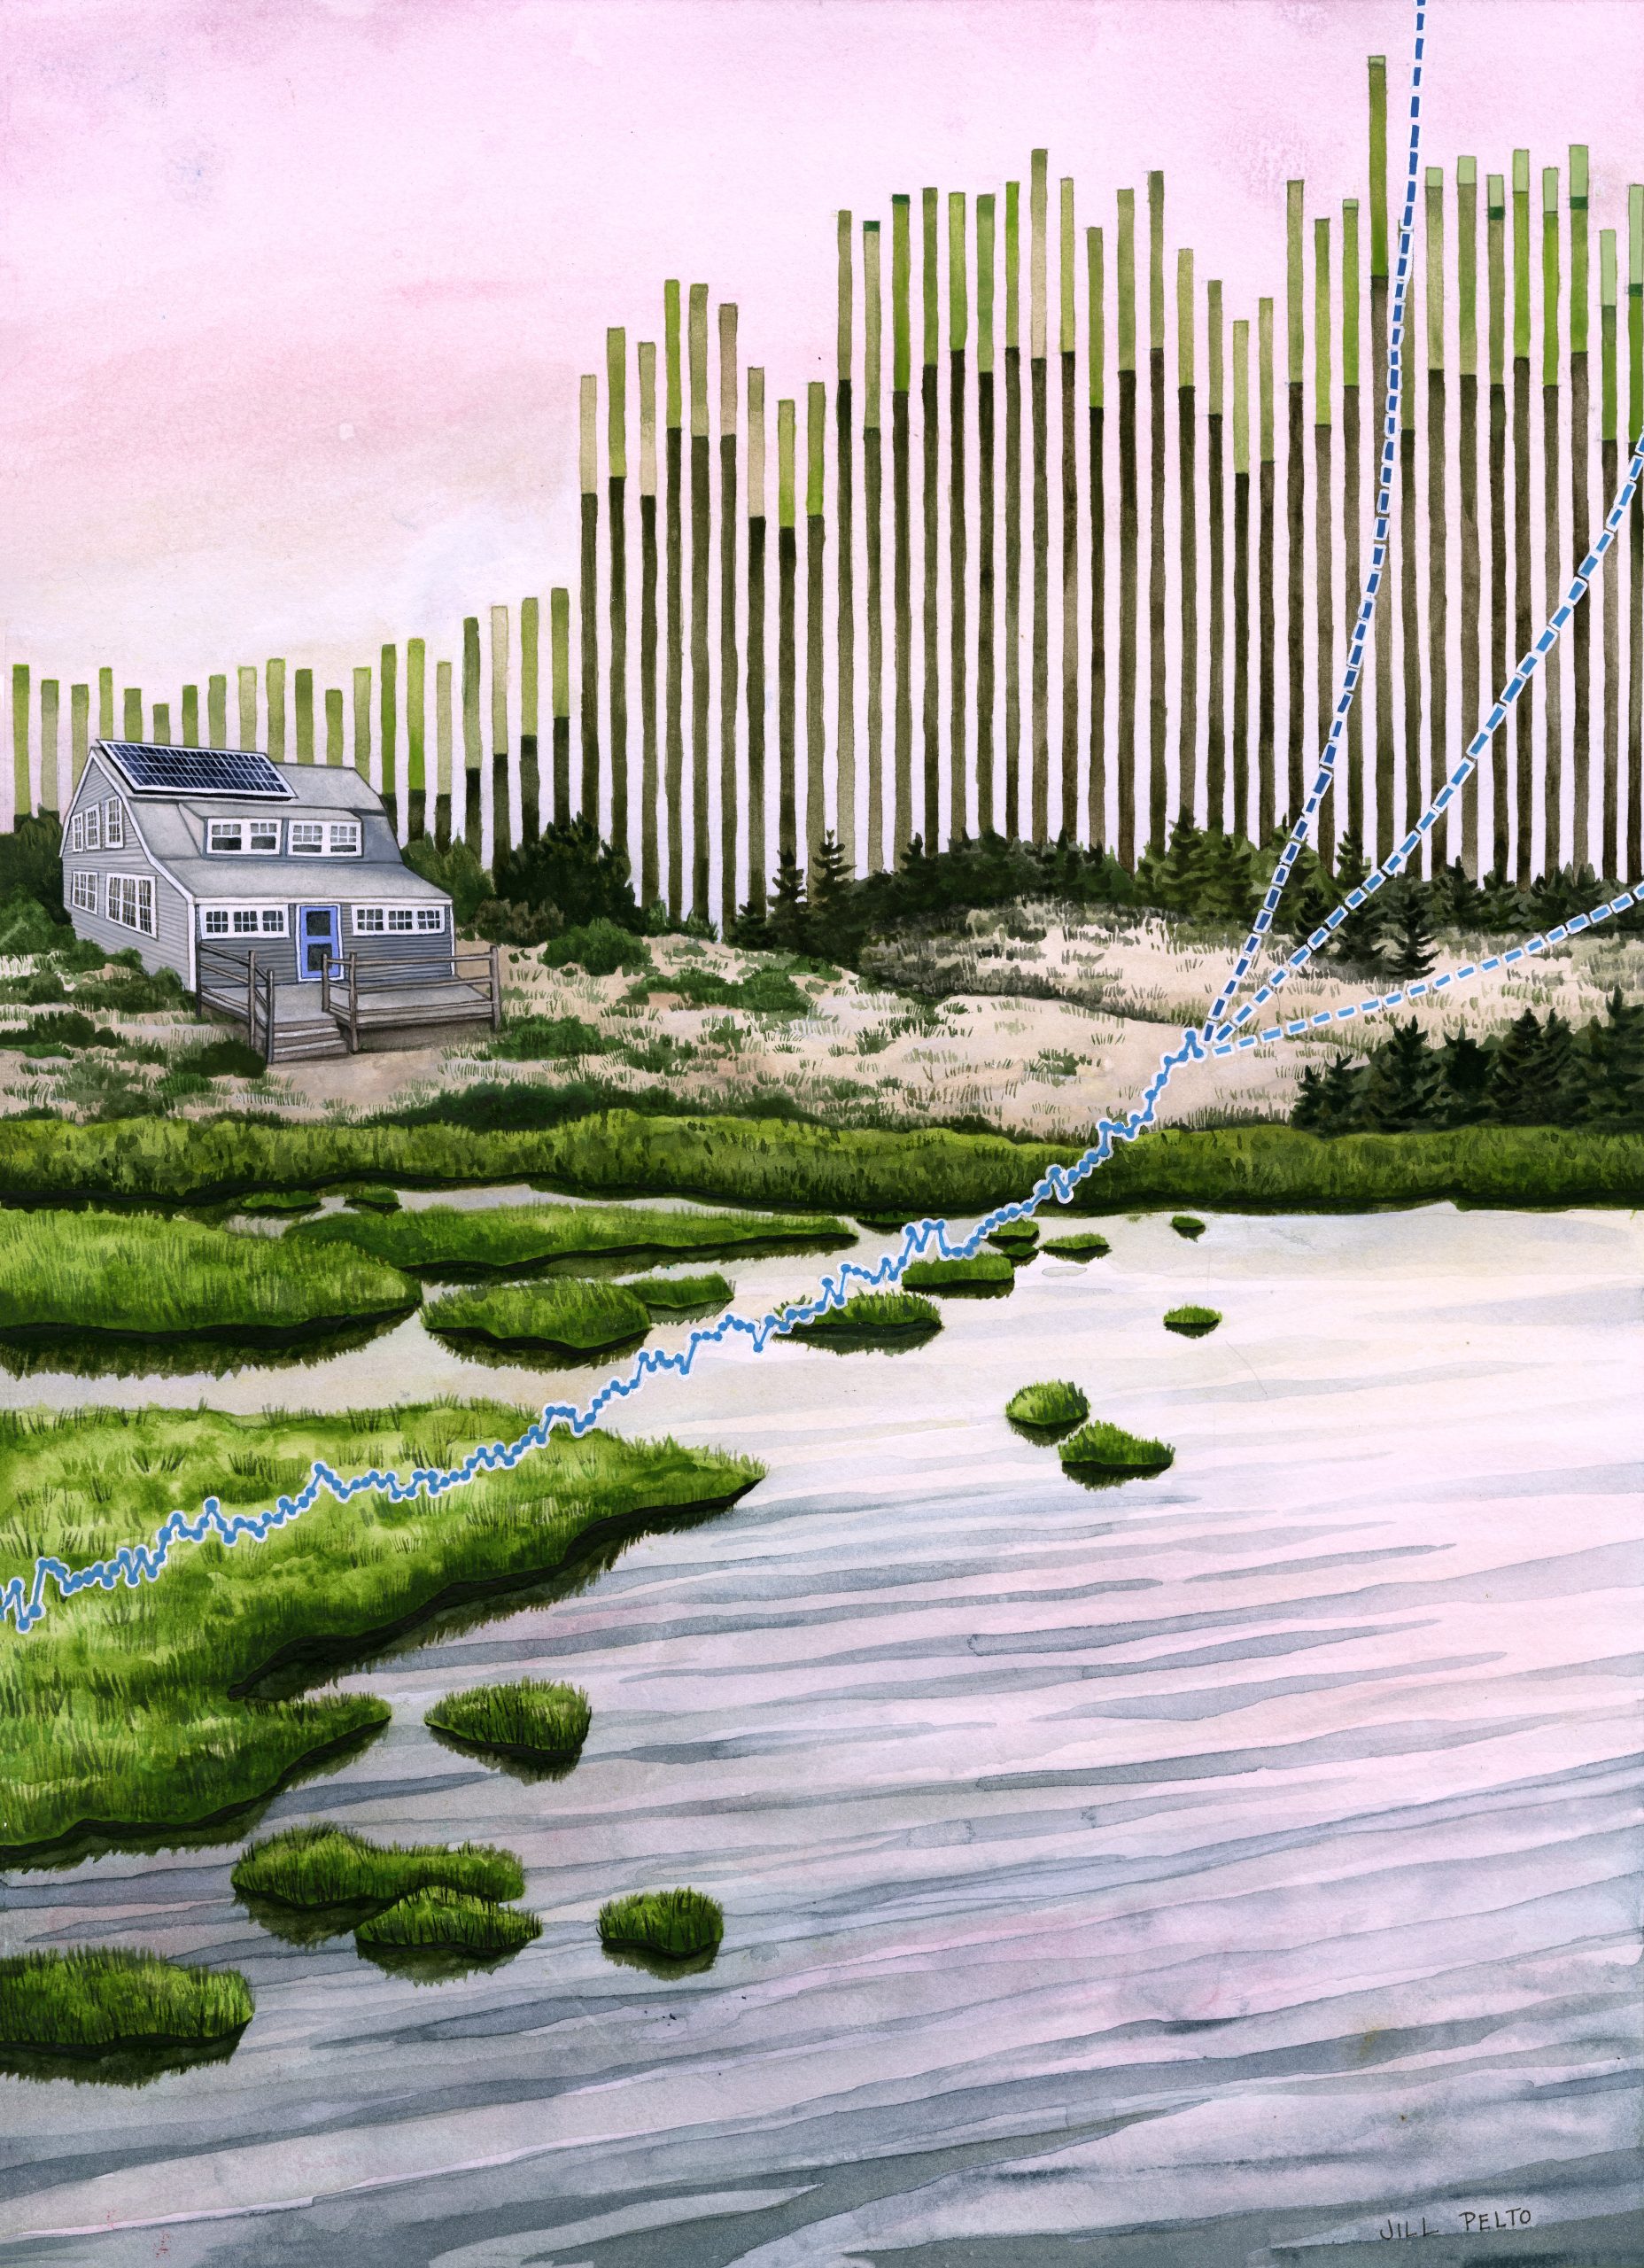
Figure 6. Jill Pelto, Rising Mitigation, 2021. jillpelto.com
The eco-visualizations described above might feel most relevant to students living in coastal areas, but a host of eco-visualizations addressing other topics exists, and those projects could be presented in a classroom setting as well. Educators working inland might consider integrating eco-visualizations dealing with the most pressing environmental issues their communities are facing. Since climate change and other environmental issues can often feel distant, eco-visualizations like the ones described above can perform a vital “de-distancing” (Misiaszek, 2021, p. 2) function as they foreground scientific data and emotionally establish our embeddedness in ecological systems. This educational process can be particularly effective when eco-visualizations are situated locally (i.e., engaging with locally relevant issues, visualizing local or regional data, and displayed in the community) and employ the divergent practices of the arts (e.g., evocative qualities, metaphor, and multisensory elements).
In addition to exposing students to professional eco-visualizations, teachers might empower them to engage in eco-visualization themselves. As eco-visualization practices integrate, yet transcend, disciplinary boundaries through the diverse thinking, knowledge, and methods they require and the broad, disciplinary-crossing, real-world problems they address, these practices could be incorporated not only into environmental education and environmental science courses, but into a range of subject areas, including STEM and STEAM courses as well as individual S-T-E-A-M disciplines. Given the ecological and climatological crises currently unfolding across the globe, educators in all disciplines might consider the ways in which ecopedagogy might infuse teaching. Eco-visualizations and related practices can offer one powerful avenue for this ecopedagogy to unfold.
Art Education for a Sustainable Planet
Embracing Ecopedagogy in K–12 Classrooms
Joy G. Bertling
References
Aho, T., Niittyvirta, P., & Google Arts and Culture. (2020). Coastline paradox [Online climate data experiment]. https://experiments.withgoogle.com/coastline-paradox
Aragón, C. (2020). FutureSHORELINE [Sculptural installation]. http://www.carolinaaragon.com/futureshoreline
Clark, K. (2011). Cleveland foreclosure quilt [Quilt]. http://www.kathrynclark.com/foreclosurequilts.html
Fall-Conroy, B. (2016). Minimum wage machine [Interactive sculpture]. https://www.blakefallconroy.com/minimum-wage-machine.html
Hehe. (2008). Nuage vert [Public installation]. http://www.hehe.org/projets/nuage-ver-no-1-helsinki
Holmes, T. G. (2007). Eco-visualization: Combining art and technology to reduce energy consumption. C&C ’07 Proceedings of the 6th ACM SIGCHI Conference on Creativity & Cognition, 153-162. https://doi.org/10.1145/1254960.1254982
Kuby, A. (2017). Sea level clock #1 [Installation]. http://www.adamkuby.com/installations/sea-level-clock
Misiaszek, G. W. (2021). Editorial: De-distancing “us” from the rest of Earth: Ecopedagogical analysis and approaches. International Studies in Sociology of Education, 30(1-2), 1-12. https://doi.org/10.1080/09620214.2021.1880333
Niittyvirta, P., & Aho, T. Lines (57° 59’ N, 7° 16’W) [Site-specific installation]. https://www.niittyvirta.com/lines-57-59-n-7-16w
Pelto, J. (2021). Rising mitigation [Mixed media data visualization]. https://www.jillpelto.com/mitigation
Studio Roosegaarde. (2016-2022). Waterlicht [Site-specific installation]. https://studioroosegaarde.net/project/waterlicht
Studio Roosegaarde. (2023). Waterlicht: A dream landscape about the power and poetry of water. https://studioroosegaarde.net/project/waterlicht
Yi-Chen, H., Yi-hui, G., & Yu-Ti, C. (2017). Polluted water popsicles [Sculptural collection]. In E. Hunt, Popsicles of pollution: Ice lollies highlight Taiwan’s contaminated waterways. The Guardian. https://www.theguardian.com/cities/gallery/2017/sep/01/popsicles-pollution-ice-lollies-taiwan-taipei-contaminated-waterways